Analytics » Publishing Options » Embedding Views in Web Pages, Web Applications and Blogs
Embedding Views in Web Pages, Web Applications and Blogs
In Virtutem Analytics you can easily embed any view (reports, tables & dashboards) you create into a website, web application, blog or an intranet page. Virtutem Analytics allows you to embed views with private access with/without login or with public access. Users visiting the website or blog will be able to see the latest live version of the view and any changes you make to the view or the underlying data will be reflected in the embedded version of the view automatically.
You can embed any type of view that you have created in Virtutem Analytics including Tables, Query tables, Charts, Pivot tables, Summary views, Tabular views and Dashboards. To embed any view into your Web page, Virtutem Analytics generates a HTML code snippet (containing an iframe HTML element), which should be included into your Web page HTML content (within the <body> </body> tags) at the appropriate position. On including this code snippet, whenever the Web page is loaded in a browser, the embedded view(s) from Virtutem Analytics will also get loaded.
By default, all views created in Virtutem Analytics are private. Only users to whom the view has been shared (For more information on how to share reports to users, Refer to the topic Sharing and Collaboration ) can see the embedded view when they visit the web page. Shared user has to login into Virtutem Analytics when the embedded iframe in the web page prompts for login. If the user has already logged into Virtutem Analytics (in the same browser), then it will not prompt for login.
In case you do not want the users to be logged into Virtutem Analytics , while accessing the Web page, then you need to generate the embed HTML code snippet with the setting Access Without Login or make the view Public.
We will discuss about the various access models for each view type in the following sections.
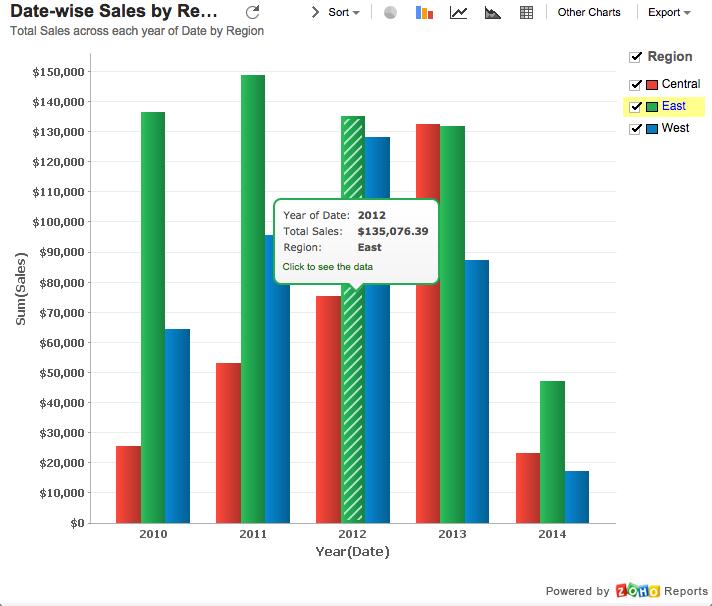
Virtutem Analytics supports embedding chart as an image or as an interactive chart into your web pages. With this you will be able to embed your charts with interactive options as you have within the Virtutem Analytics service such as toolbar menu, user filters, mouse over effects. Depending on the option selected the Embed chart option HTML code snippet (which links directly to your report) will generated and that can be embedded into your web page.
When you embed a chart in interactive mode in a web page, then users visiting the web page can view and interact with the chart as you could do when you view the chart within the Virtutem Analytics user interface. The following interactions are possible when a chart is embedded in interactive mode:
- Mouse over the chart for tooltips & highlights.
- Click on any data point in the chart to view the underlying data (drill down).
- You can also include the chart toolbar in your embedded chart to enable users to change the chart type.
- Apply User Filters, if the chart contains user filters
- Interact with legend for mouse over effects and chart filtering based on values listed in the legend.
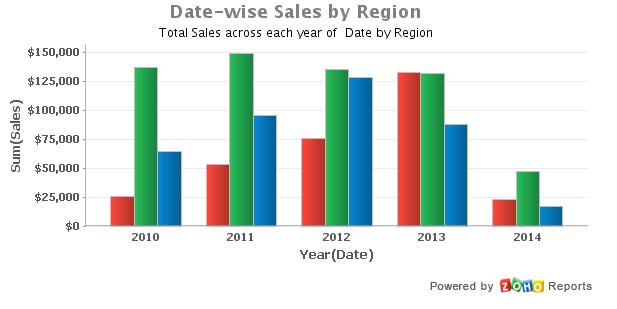
When you embed a chart as an image, the chart will be generated as a static image and thus the web page will get loaded faster.
The following are the three access models that you can choose while embedding your chart for both Interactive and Image mode.
- Embedding with Private Access with Login
- Embedding with Private Access without Login
- Embedding with Public Access
When you embed your chart in a web page, by default it will be set to embed with Private Access with Login setting to provide highest level of security to your chart. In this access mode you have to share the chart to your users and those shared users will be able to access the embedded chart, on successful login. Any other users to whom you have not shared the view or public users will not be able to access the embedded chart.
You can embed the charts with Private Access with Login setting by following the steps below:
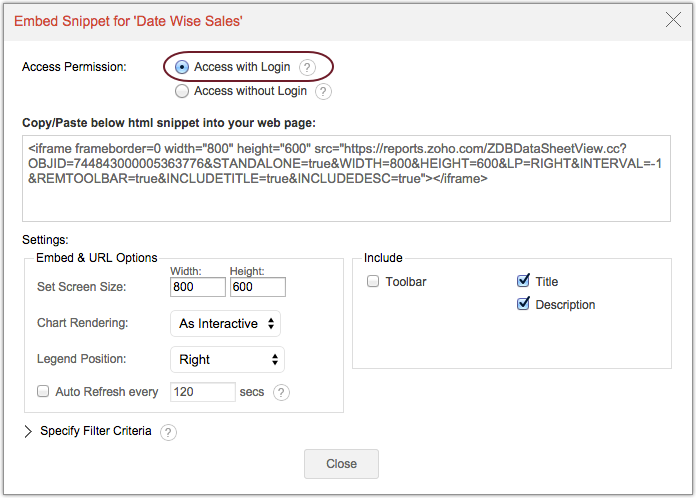
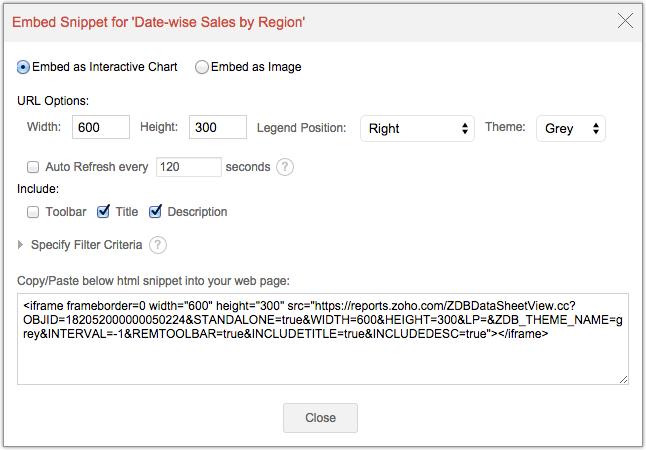
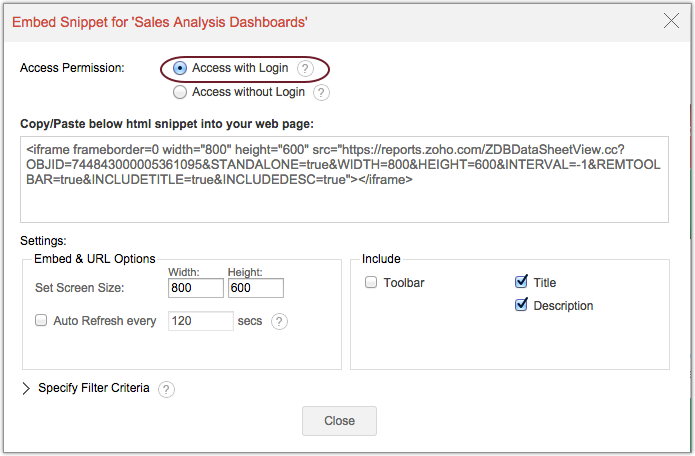
- From Explorer tab, open the chart that you want to embed and invoke Publish > Embed in Website or Blog option in the toolbar. The Embed Snippet dialog box will open.
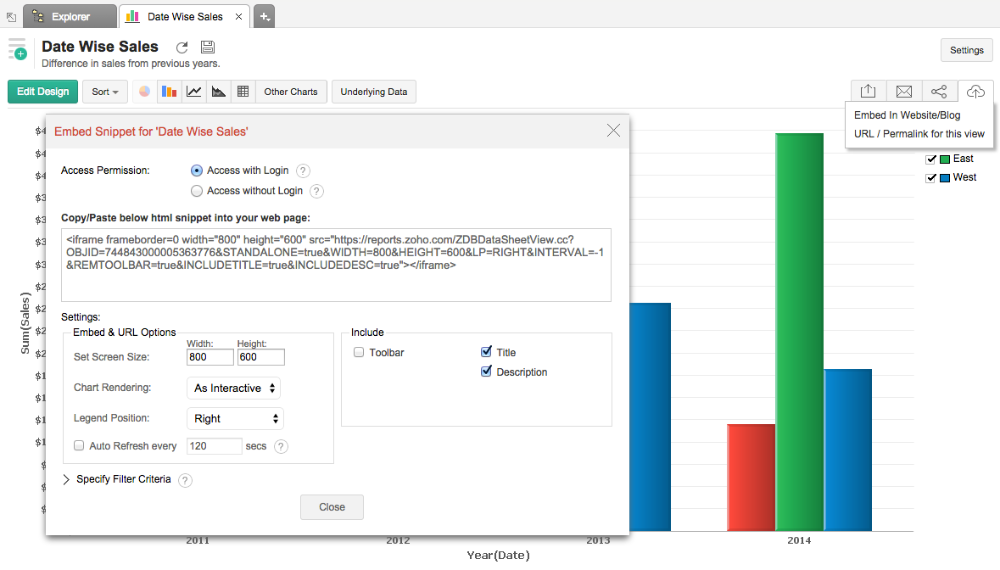
- Access Permission will be set to Access with Login by default.
- The Setting group box provides opton to customize the embeded chart. Specify the width and height in the corrresponding boxes in Set Screen Size option.
- In the Chart Rendering section selecte As Interactive or As Image .
- Select the required legend position for the chart from the drop-down list under the Legend Position option. The supported options are:
- Right - Places the legend to the right side of the chart
- Left - Places the legend to the left side of the chart.
- Top-Left - Places the legend to the top left of the chart below the title.
- Top-Center - Places the legend to the top center of the chart below the title.
- Top-Right - Places the legend to the top right of the chart below the title.
- Bottom-Left - Places the legend to the bottom left corner of the chart.
- Bottom-Center - Places the legend to the bottom center of the chart
- Bottom - Right - Places the legend to the bottom right corner of the chart.
- Select a theme from the drop down menu under Theme option. The selected theme will be applied only when you have the Toolbar (next option discussed) included.
- Select the Auto Refresh every N seconds checkbox and then specify time in seconds to automatically refresh your view to show latest data.
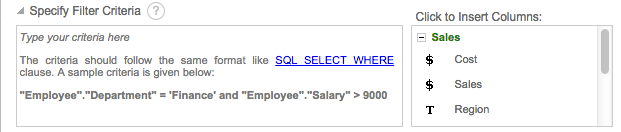
- You can choose to display a selective set of data in your embedded view using the Specify Filter Criteria option. To know how to specify filter criteria, refer here.
- Select Toolbar , if you want to include the chart toolbar when embedded. This option will be available only when you embed as an interactive chart.
- Copy the HTML <iframe> code displayed in the text area and paste it in to the corresponding HTML source code of your web page/blog into which you are embedded this view. The snippet should be included within <body> </body> tags in the web page.
- Click Close.
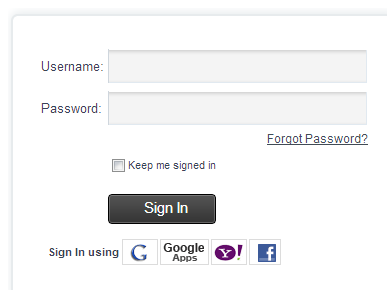
Once the <iframe> code is pasted into HTML source code of your web page/blog, when a user visits the web page it will prompt for login details as shown below, in case the user has not logged in already into Virtutem Analytics . On successful login they will be able to access the chart.
In case you want to embed a chart into a private web page, like an intranet web page of a company that only employees can see, and do not want them to login into Virtutem Analytics every time they visit the web page, then you have to embed the chart with private Access without Login setting. You can embed the chart either as an interactive chart or as an image in this model. When this setting is selected Virtutem Analytics will generate a embed URL (within an iframe code) which will contain a big randomly generated private key ( private link) , making them secure and very hard (if not impossible) to guess.
To embed a chart with private access without login:
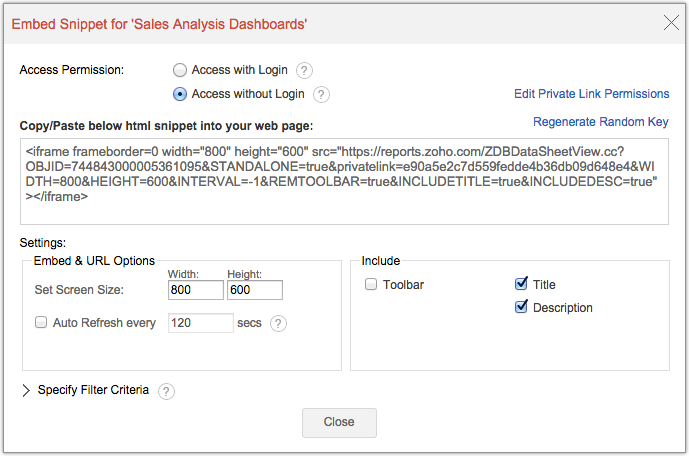
- Open the chart you want to embed and then click Publish > Embed in Website or Blog option in the toolbar. The Embed Snippet dialog box will open.
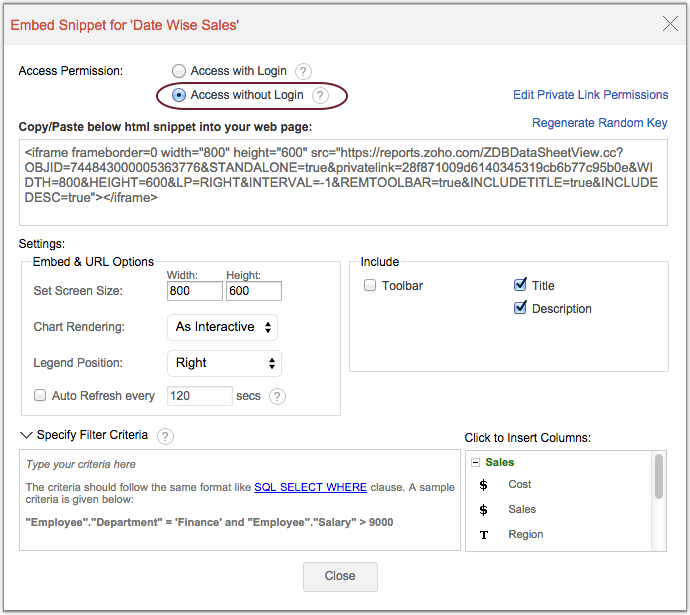
- Select Access without Login in the Access Permision section.
- Customize the setting in the dialog to generate the embed iframe as per your requirement. For more details about the setting refer to Embedding Chart with Private Access with Login section.
- If you want to edit the permissions to be granted to this view, then click Editing Private Link Permissions link. The Edit Permissions for the selected tables/report dialog box will open.
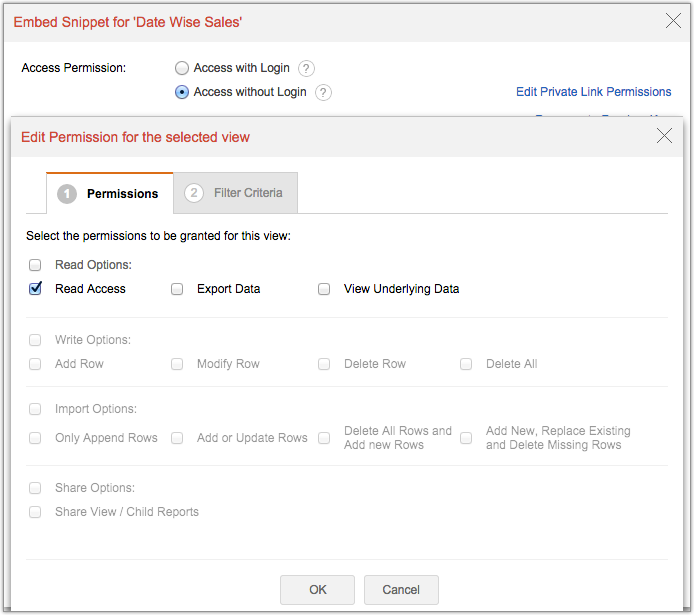
- Grant permissions you want to give for the chart. An alternative way to change permissions is described in the Editing Permissions of Embedded Views topic.
- Copy the HTML <iframe> code displayed in the text area and paste it in to the corresponding HTML source code of your web page/blog into which you are embedded this view. The snippet should be included within <body> </body> tags in the web page.
- Click Close.
| Note: |
|---|
|
In case you want your embedded chart to be accessible to all the users who visits your web page and do not require the random key based link generation (as in Private access without login option), then you have to embed your chart with Public Access setting.
- Make the chart that you want to embed public. Refer to the topic Making Views/Database Public for information on how to make a chart public and to grant the required permissions.
- Invoke Publish -> Embed in Website or Blog option in the toolbar. A dialog box appears as shown below:
- Select the required view customization options. For more details about the setting refer to Embedding Chart with Private Access with Login section.
- Copy the HTML <iframe> code displayed in the text area and paste it into the corresponding HTML source code of your web page/blog. The snippet should be included within <body> </body> tags in the web page.
You can edit permissions of the embedded chart anytime you want. Refer to the Editing Permissions of Embedded Views section to know how to edit permissions of a embedded view.
Virtutem Analytics supports embedding view (Table, Query Table, Pivot Table, Summary View and Tabular View) created in Virtutem Analytics into your web pages. To embed a view created in Virtutem Analytics , you need to get the corresponding HTML code snippet generated by Virtutem Analytics and embed the same into the appropriate position in your web page.
Following are the three access models that you can choose while embedding your view (similar to embed options provided for the Charts discussed in the previous section):
- Embedding with Private Access with Login
- Embedding with Private Access without Login
- Embedding with Public Access
When you embed the view with Private Access with Login , then it would prompt for the users to login with Virtutem Analytics s login ID to access the embedded view. Also, only users to whom you have shared the view (Using the Share option) would be able to access the embedded view, on successful login. This is the most secure way of embedding a view.
The following steps illustrates how to embed a table created in Virtutem Analytics into a web page
- From the Explorer tab, open the corresponding report in the reporting database that you want to embed and invoke Publish > Embed in Website or Blog option in the toolbar. In this example we are using a table. A dialog box opens as shown below.
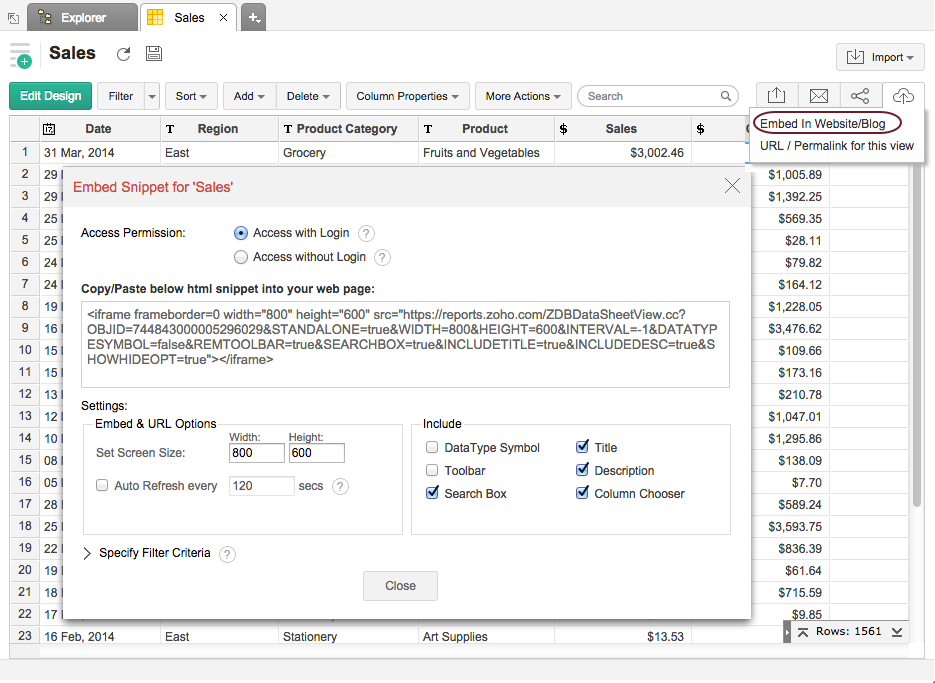
- Edit Width and Height values to make the embed report size fit to your needs. Using Theme option, select theme color for the report that is to be embedded.
- Select the required options provided for the view.
The following table describes various options available for different types of views.
| OPTION | DESCRIPTION | APPLICABLE FOR |
| Width | Allows you to set the width of the embedded view. | Applicable for Tables, Query Tables, Pivots, Summary and Tabular views. |
| Height | Allows you to set the height of the embedded view. | Applicable for Tables, Query Tables, Pivots, Summary and Tabular views. |
| Theme | Allows you to set the theme of the embedded view. | Applicable for Tables, Query Tables, Pivots, Summary and Tabular views. |
| Auto Refresh Every N Seconds | Allows you to automatically refresh your view at a set interval to display latest data. | Applicable for Tables, Query Tables, Pivots, Summary and Tabular views. |
| Data Type Symbol | Provides the data type symbol of the corresponding column in the header, when you embed a view. | Applicable for Tables, Query Tables and Tabular views. |
| Toolbar | Provides a toolbar of the corresponding view at the top, when embedded. | Applicable for Tables, Query Tables, Pivots, Summary and Tabular views. |
| Search Box | Provides a search box at the top of the view. When you check the Toolbar option, this option becomes inactive. | Applicable only for Tables. |
| Column Chooser | Provides an option to show or hide columns from the view | Applicable for Table, Tabular view and Query Table, |
| Title | Provides title of the View | Pivot and Summary views. |
| Description> | Provides a brief description of the view | Applicable for Pivot and Summary views. |
| Specify Filter Criteria | Allows you to filter the data by specifying a filter criteria. | Applicable for Tables, Query Tables, Pivots, Summary and Tabular views. |
- HTML code snippet generated and displayed in the text area will be updated based on the values that you choose.
- Copy the HTML <iframe> code displayed in the text area and paste it in to the corresponding HTML source code of your web page/blog into which you are embedded this view. The snippet should be included within <body> </body> tags in the web page
- Click Close
Once the <iframe> code is pasted into HTML source code of your web page/blog, when a user visits the web page it will prompt for login details as shown below, in case the user has not logged in already into Virtutem Analytics .
.png)
On successful login they will be able to access the view.
In case you do not want all your users to login to Virtutem Analytics , but still want to share the view securely, then you can embed the view into a private web page with Private Access without Login . When this option is selected a HTML code snippet with a big randomly generated, hard to guess private key ( private link) will be generated which you can embed in your web page.
To embed a table with private access without login, follow the steps given below:
- Open the table of the reporting database that you want to embed and Invoke Publish > Embed in Website or Blog option in the toolbar. A dialog box appears as shown below.
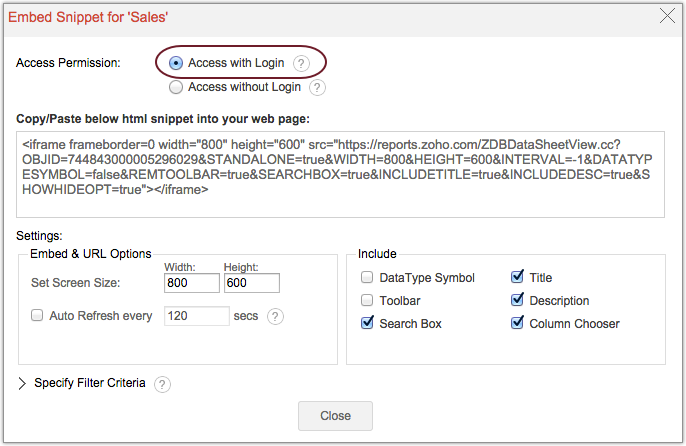
- Select Access without Login in the Access Permision section.
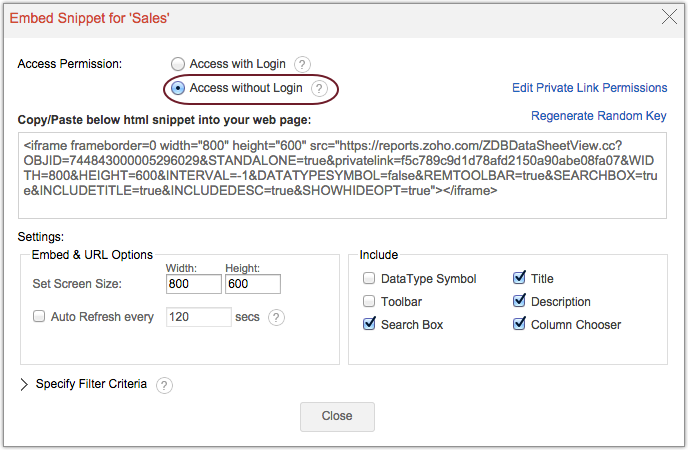
- Select/Edit the required options in the dialog box. For details about these options, refer to the Embedding with Private Access with Login section.
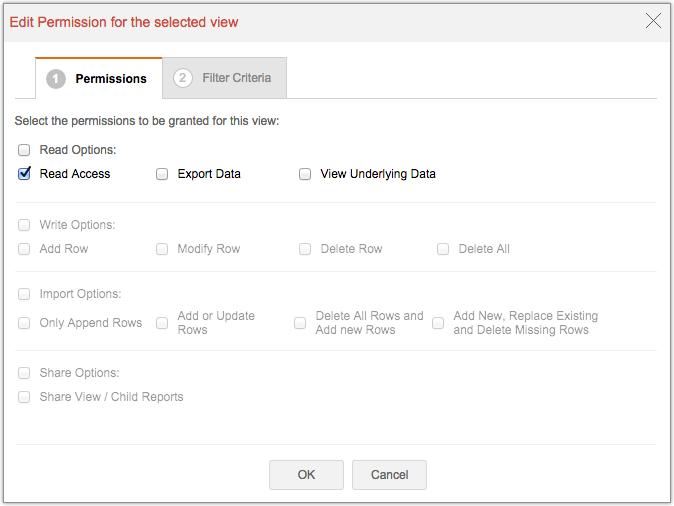
- If you want to edit the permissions to be granted to this view, then click Editing Private Link Permissions link. A dialog box appears as shown below:
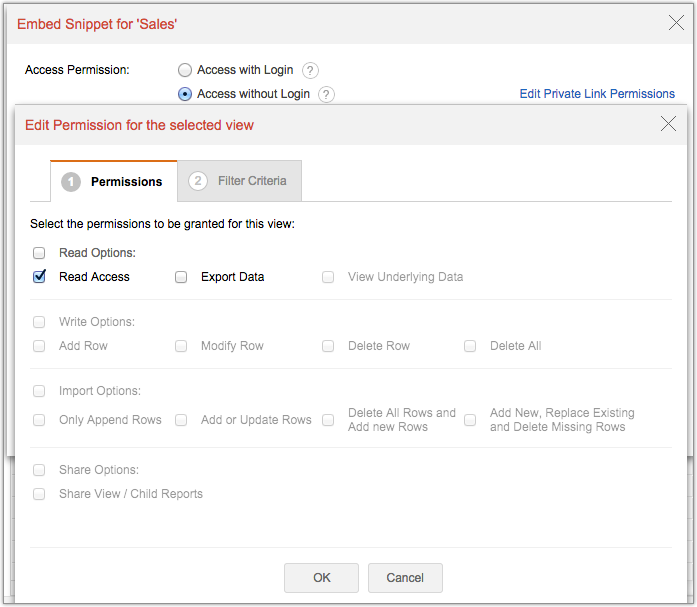
- Grant or remove Read/Export permissions for the selected table by selecting/deselecting the corresponding check boxes and then click OK . An alternative way to change permissions is described under the topic Editing Permissions of Embedded Views section.
- Copy the HTML <iframe> code displayed in the text area and paste it into the corresponding HTML source code of your web page/blog into which you are embedded this view. The snippet should be included within <body> </body> tags in the web page.
- Click Close.
| Note: |
|---|
|
| Regenerate Random Key |
|---|
|
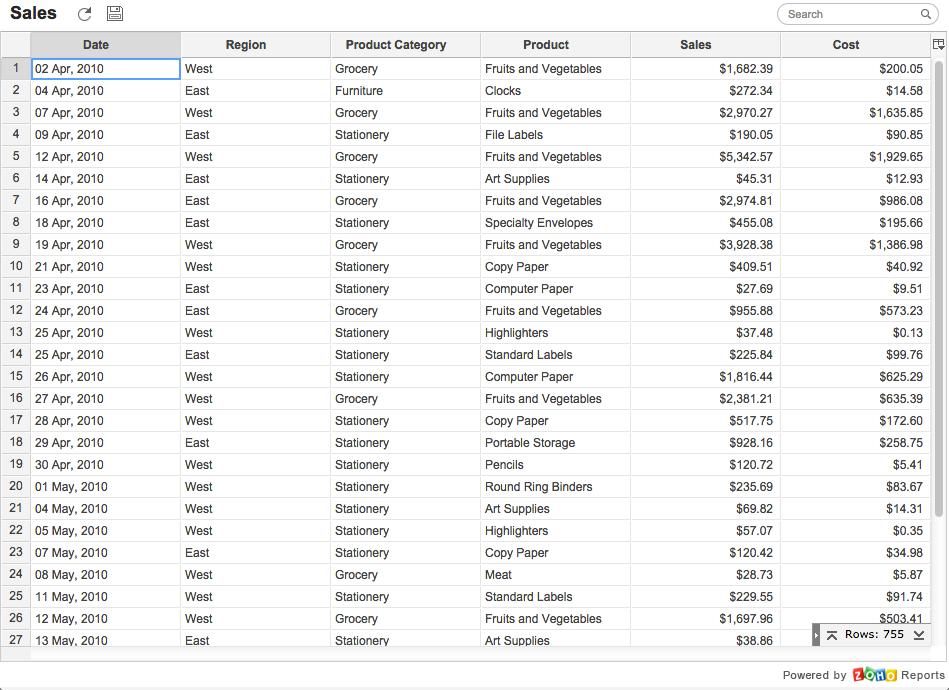
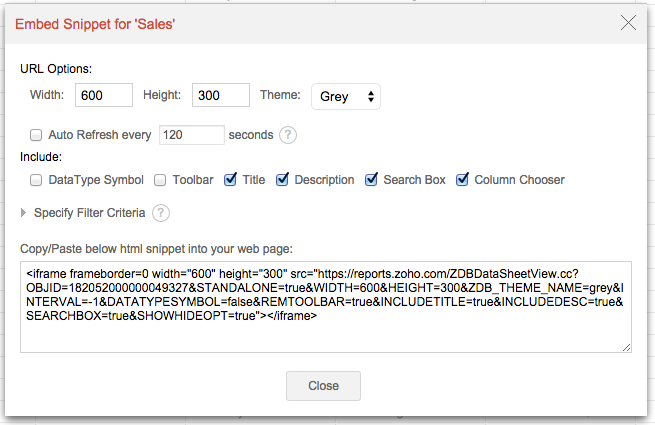
After embedding with private access without login , the embedded table is displayed as shown below when a user visits the web page (without prompting for login).
.jpg)
In case you want your embedded view to be accessible to all the users who visits your web page, you have to embed your view with Public Access setting. To embed a table with public access, do the following:
- Make the table public. Refer to the topic Making Views/Database Public to know about how to make a report public and grant the required permissions.
- Invoke Publish -> Embed in Website or Blog option in the tool bar. A dialog box appears as shown below.
- Select the required view customization options. For details about these options, refer to the Embedding with Private Access with Login section.
- Copy the HTML <iframe> code displayed in the text area and paste it into the corresponding HTML source code of your web page/blog. The snippet should be included within <body> </body> tags in the web page.
- Click Close .
You can edit permissions of the embedded view anytime you want. Refer to the Editing Permissions of Embedded Views section to know how to edit permissions of a embedded view.
Virtutem Analytics provides support to embed a live dashboard into a web page and thus enables you to display multiple reports for quick and easy data analysis / visualization. You can embed a dashboard similarly as you embed other views.
The following are the three access models that you can choose from while embedding your chart (similar to embed options provided for the Charts discussed in the previous section):
- Embedding with Private Access with Login
- Embedding with Private Access without Login
- Embedding with Public Access
You can embed the dashboard following the same steps as described for other view types in the previous sections. To embed a dashboard, you need to get a HTML code snippet, which links directly to your dashboard. You can do that as follows:
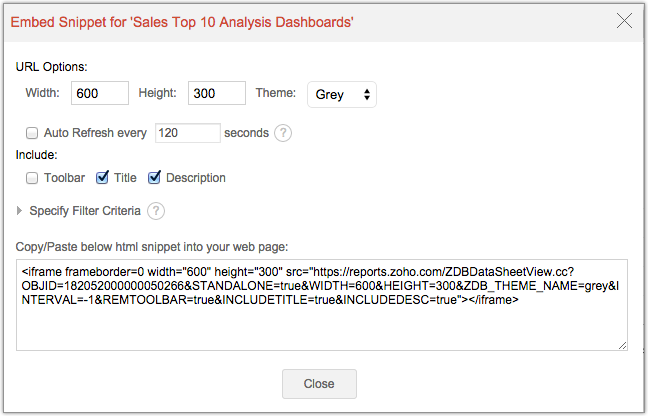
- From the Explorer tab, open the dashboard that you want to embed and invoke Publish > Embed in Website or Blog option in the toolbar. A dialog box appears as shown below.
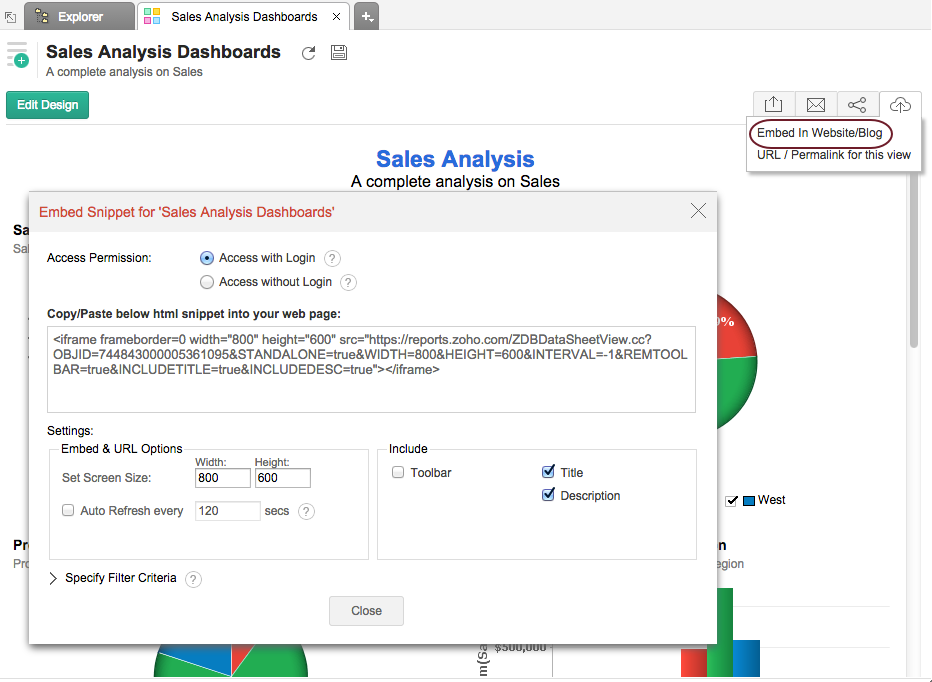
- Edit the width and height values to generate the embed iframe to fit the dashboard into your web page according to your sizing needs.
- Select a theme color from the drop down menu under Theme option.
- Select the Auto Refresh every N seconds checkbox and then specify time in seconds to automatically refresh your view to show latest data.
- You can choose to display a selective set of data in your embedded view using the Specify Filter Criteria option. To know how to specify filter criteria, refer here.
.png)
- Select Toolbar , if you want to include the chart toolbar when embedded.
- Copy the <iframe> code and paste it in to the source code of your web page. The snippet should be included/pasted within <body> </body> tags in the web page.
- Click Close .
Once the <iframe> code is pasted into HTML source code of your web page/blog, when a user visits the web page it will prompt for login details as shown below, in case the user has not logged in already into Virtutem Analytics . On successful login they will be able to access the dashboard.
- Open the dashboard of the reporting database that you want to embed and Invoke Publish > Embed in Website or Blog.
- Select Access without Login in the Access Permision section.
- Edit the width and height values to generate the embed iframe to fit the dashboard into your web page according to your sizing needs.
- Select a theme color from the drop down menu under Theme option.
- Copy the HTML <iframe> code displayed in the text area and paste it into the corresponding HTML source code of your web page/blog. The snippet should be included within <body> </body> tags in the web page.
- Click Close .
- Make the dashboard that you want to embed public. Refer to the topic Making Views/Database Public for information on how to make a report or dashboard public and to grant the required permissions.
- Invoke Publish > Embed in Website or Blog option in the toolbar. A dialog box appears as shown below:
- Edit the width and height values to generate the embed iframe to fit the dashboard into your web page according to your sizing needs.
- Select a theme color from the drop down menu under Theme option.
- Copy the HTML <iframe> code displayed in the text area and paste it into the corresponding HTML source code of your web page/blog. The snippet should be included within <body> </body> tags in the web page.
- Click Close.
Editing Permissions of Embedded Dashboard
You can edit permissions of the embedded dashboard anytime you want. Refer to the Editing Permissions of Embedded Views section to know how to edit permissions of a embedded view.
If you want to edit previously granted permissions provided for the embedded view (Table, Charts, Query Table, Pivot, Summary, Tabular views and Dashboard) or to completely remove access to the private or public user, do the following.
- Open the corresponding view that has been embedded and invoke the Share >Edit Existing Shared Details in the toolbar. A dialog will come up as shown below:
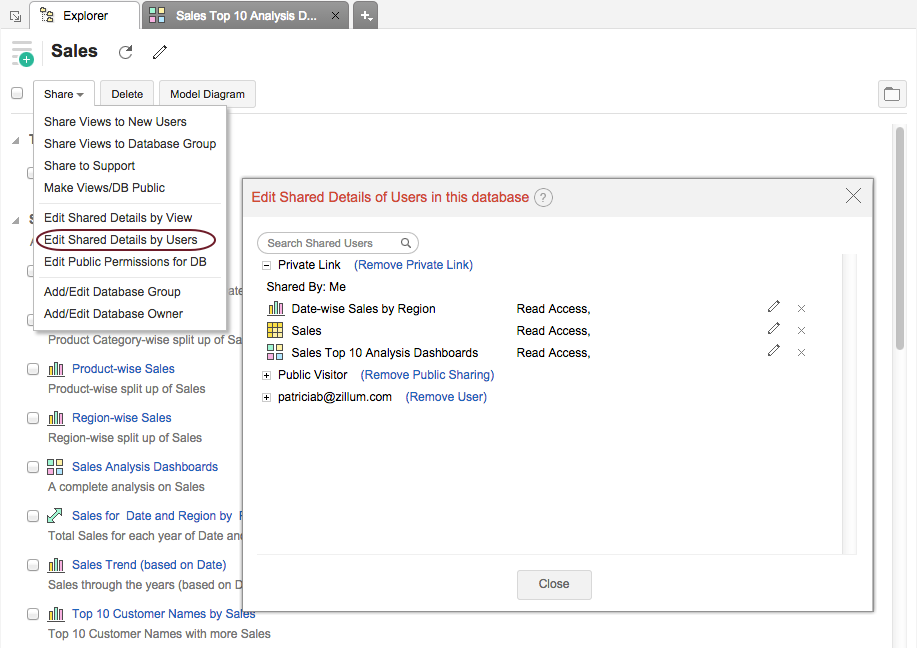
- To edit permissions of a view embedded using private link (private embed without login, click Edit Permission link next to Private Link
- To edit permissions granted for an embedded view to an individual users (i.e. through private embed with login) click on the Edit Permission link adjacent to the corresponding user name.
- To edit permissions granted for an embedded view with public access, click Edit Permission link next to Public Visitor . A dialog will come up as shown below:
You can grant or remove permissions for the selected view by selecting/deselecting the corresponding check box in the Edit Permission dialog box. Click OK and then Close to complete the process. If you want to remove access to the private/public or shared users, click on the corresponding Remove link adjacent to each shared member and then click Close.
Virtutem Analytics offers a powerful feature of applying dynamic filters when you embed any view into your Web page. These filters get applied on the fly over the data displayed as part of the view, when users access them in the embedded web page. Using this feature, you can embed the same view in different web pages applying different set of filter criteria, to suit the allowed permission, context and profile of the user who is viewing the page. For example, an embedded sales report can have a 'Region' based criteria in each page that it's embedded, creating a scenario such that, when a sales person from say Region East views his/her accessible page, will only see the Sales from that region in the report embedded. A similar setup can be applied for sales person from other regions.
Filters can be applied by passing the required filter criteria to the parameter named ZOHO_CRITERIA and appending it as part of the Embed URL present in the HTML <iframe> code snippet. The embedded view's data is filtered and displayed based on the criteria specified, whenever the web page is loaded in the browser.
Example:
The generated HTML code snippet for embedding your view with the <iframe> tag would look like something given below (the following code snippet is for a Table):
<iframe frameborder="0" width="'400'" height="'300'" src="'http://reports.zoho.com/ZDBDataSheetView.cc?OBJID=19601000000386026&STANDALONE=true&WIDTH=400&HEIGHT=300&ZDB_THEME_NAME=blue&DATATYPESYMBOL=false&REMTOOLBAR=true&SEARCHBOX=true'></iframe>
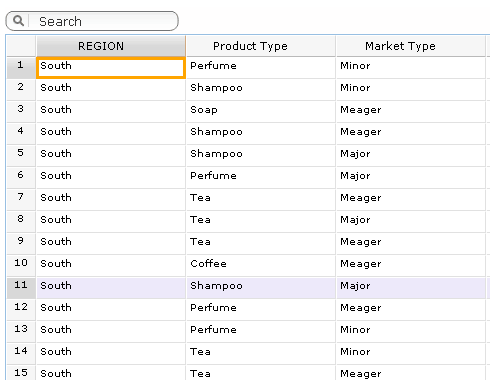
The above snippet displays a Sales table when embedded in a web page. To limit the view to just show the Sales in the South Region, add the parameter &ZOHO_CRITERIA=("Region" = 'South') to the <iframe> code snippet. In this parameter Region is the column name in the view, which is filtered to display values matching the region South. The parameter should also be encoded. The encoded value will look like &ZOHO_CRITERIA="Region"='South'. The complete code snippet with this parameter is given below:
"<iframe frameborder="0" width="'400'" height="'300'" src="'http://reports.zoho.com/ZDBDataSheetView.cc?OBJID=19601000000386026& ZOHO_CRITERIA="Region"='South'& STANDALONE=true&ZDB_THEME_NAME=blue&DATATYPESYMBOL=false&REMTOOLBAR=true&SEARCHBOX=true'></iframe>
When you embed the above code snippet into a web page, the table view displayed will contain only the values matching the Region South
Filter Criteria Format
The filter criteria that is passed follows the same format as that of the SQL SELECT Query's WHERE clause . You can also use SQL in-built functions as part of the criteria. These built-in functions should be the functions supported by any of Oracle, MS SQL Server, MySQL, DB2, Sybase, ANSI SQL, Informix and PostgreSQL databases.
The generalized format of simple criteria is given below.
ZOHO_CRITERIA="( <columnname/SQLexpression/SQLfunctioncalls><relationaloperator><value/columnname/SQLexpression/SQLfunctioncalls>)"
Description:
| column name | Refers to the name of the column on which you are applying the criteria |
| SQL Expression | Any valid SQL Expression. Eg: "Sales"-"Cost">1000 Supported Arithmetic Operators are: +, -, *, / |
| SQL Function call | Oracle, MS SQL Server, MySQL, DB2, Sybase, ANSI SQL, Informix and PostgreSQL databases in-built standard functions |
| relational operator | Any relational operator to compare values supported in an SQL SELECT Query WHERE clause>. The following operators can be used: · = · != · < · > · <= · >= · LIKE · NOT LIKE · IN · NOT IN · BETWEEN |
| Value | Refers to the exact value to match Eg.: "Department" = 'Finance" here 'Finance' is a literal value to match. |
You can also define filters containing multiple columns as the example given below
((Region='South' AND "Sales" < 10000) OR ("Region='West' AND "Sales" < 10000))
Notes for Criteria formation: |
|---|
|
Refer to the SQL SELECT WHERE clause documentation to know more on how to construct the filter criteria.