Analytics » Pivot Table
Pivot Table
Pivot Table allows you to dynamically rearrange, group and summarize data for easy analysis of large sets of data. You can transform data in a table(s) into interactive and meaningful summaries easily by using intuitive drag and drop interface provided by Virtutem Analytics . You can also filter, sort and customize the appearance and content of your Pivot Table the way you want it, by using wide range of options provided by Virtutem Analytics . For users who view/access the pivot tables, Virtutem Analytics offers a range of interactivity options like Data Drill Down, User Filters, Sorting, Export etc.,
Following screen-shot displays the basic layout of a Pivot Table in Design Mode.
- Columns from the source table that you assign to a row orientation in a Pivot Table
- Values of the column from the source table that you assign to a column orientation in a Pivot Table.
- Column from the source table that contains values to be summarized.
- Column/Rows in the Pivot Table that contains grand summary information.
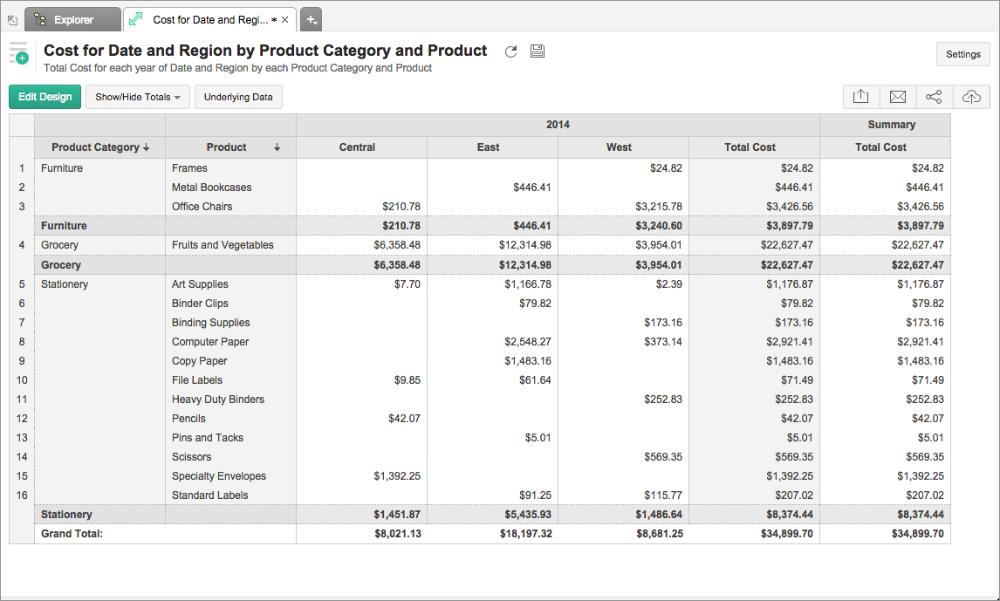
Following screen-shot displays the basic layout of a Pivot Table in View Mode.
In this chapter we will discuss about the following: